Alanine Scan
Given a PDB structure of atomistic resolution, the alanine scan method iteratively perturbs the native
structure by mutating single amino acids to alanine one residue at a time. In this manner, the method
can predict those mutations that are predicted to significantly affect the free energy of association for
a complex according to the thermodynamic cycle. For reference, please refer to [Kieslich2011-2] and
[Gorham2011-2] as they present published results for the Barnase-Barstar test system. You may download all
necessary files for this example at this link: download.
Alascan(pdb[, pdb2pqr_exe, apbs_exe, …]) |
Summary Summary of internal varialbles in the Alascan class. |
Example case: Barnase-Barstar
Open a new python session, import the Alascan class, and import the plotScan function:
from aesop import Alascan, plotScan, writePDB
try:
    from aesop import plotNetwork
except:
    print 'Unable to import plotNetwork, is the NetworkX library installed?'
Warning
If you are planning to leverage multiple CPU threads for a faster analysis, please know that extra steps may be required. Specifically, you must protect the entry point of the program according to multiprocessing documentation. You may do this by putting the following code at the beginning of your Python script:
if __name__ == '__main__':
    # place remaining code here and maintain level of indentation
This precaution becomes unnecessary if you are running the analysis inside an interactive Python session. In the downloadable zip files, we have already placed this protection in the run script, so that you may run the analysis as follows in your platform’s terminal:
python run_alascan.py
Failure to protect the entry point may result in an infinite loop of process spawning.
Next, you must specify the full paths to your apbs, coulomb, and pdb2pqr executables, if
the paths for the directories containing the executables have not already been added to the environment.
Here is an example for a Windows system:
path_apbs    = 'C:\\APBS\\apbs.exe'
path_coulomb = 'C:\\APBS\\coulomb.exe'
path_pdb2pqr = 'C:\\PDB2PQR\\pdb2pqr.exe'
Next we will specify the jobname and pdbfile to used in the method. After running the alanine scan, jobname
will be used to create a folder where files for the method will be generated. You can download the PDB file
for this example from this link (download).
Make sure you place the PDB in your working directory:
jobname = 'alascan'
pdbfile = 'barnase_barstar.pdb'
Warning
If you are using your own PDB, make sure the PDB contains no missing heavy atoms. Consider also removing non-standard amino acids. PDBFixer is one option for cleaning PDB files in preparation for AESOP.
The Alascan class will need to know how to define each subunit of the protein complex. To do this, the user should specify a list of selection strings. Each element of the list should be a stand-alone selection string that fully describes how to select the associated subunit. If the selection string list has only 1 element, then be aware that you may only calculate solvation free energies as no association of subunits occurs. In this example, barnase is chain A, and barstar is chain B. Thus, we specify the selection string in the following manner:
selstr = ['chain A', 'chain B']
Finally, we may initialize the Alanine scan class:
alascan = Alascan(pdb=pdbfile,
                  pdb2pqr_exe=path_pdb2pqr,
                  apbs_exe=path_apbs,
                  coulomb_exe=path_coulomb,
                  jobname=jobname,
                  selstr=selstr,
                  minim=False)
Note that by default the Alanine scan class will not minimize the structure of mutants. Since the Alascan class seeks to quantify the electrostatic contribution of each amino acid, minimization is unnecessary for our purposes. No clashes should be introduced by the side-chain truncation mutation scheme. If you still prefer to perform minimization, please set minim=True when the class is initialized. In either case, results with or without minimization should be extremely similar.
Alternatively, if paths to apbs, coulomb and pdb2pqr are already added to environment then you may initialize as follows:
alascan = Alascan(pdb=pdbfile, jobname=jobname, selstr=selstr)
After initialization, you can run the analysis in series:
alascan.run()
… or you can run the analysis in parallel on a certain number of threads (don’t pass a number if you wish to use half of available threads):
alascan.run_parallel(6)
After the run is complete, AESOP will report if any Warnings or Errors were detected in APBS or PDB2PQR. The full logs are stored in the alascan.logs and can be viewed or written to file in the following manner:
alascan.viewLogs()
alascan.writeLogs(filename="alascan_logs.txt")
Once complete, you can view the results as a barplot:
plotScan(alascan, filename='alascan.png')
You should end up with a figure similar to the following image:
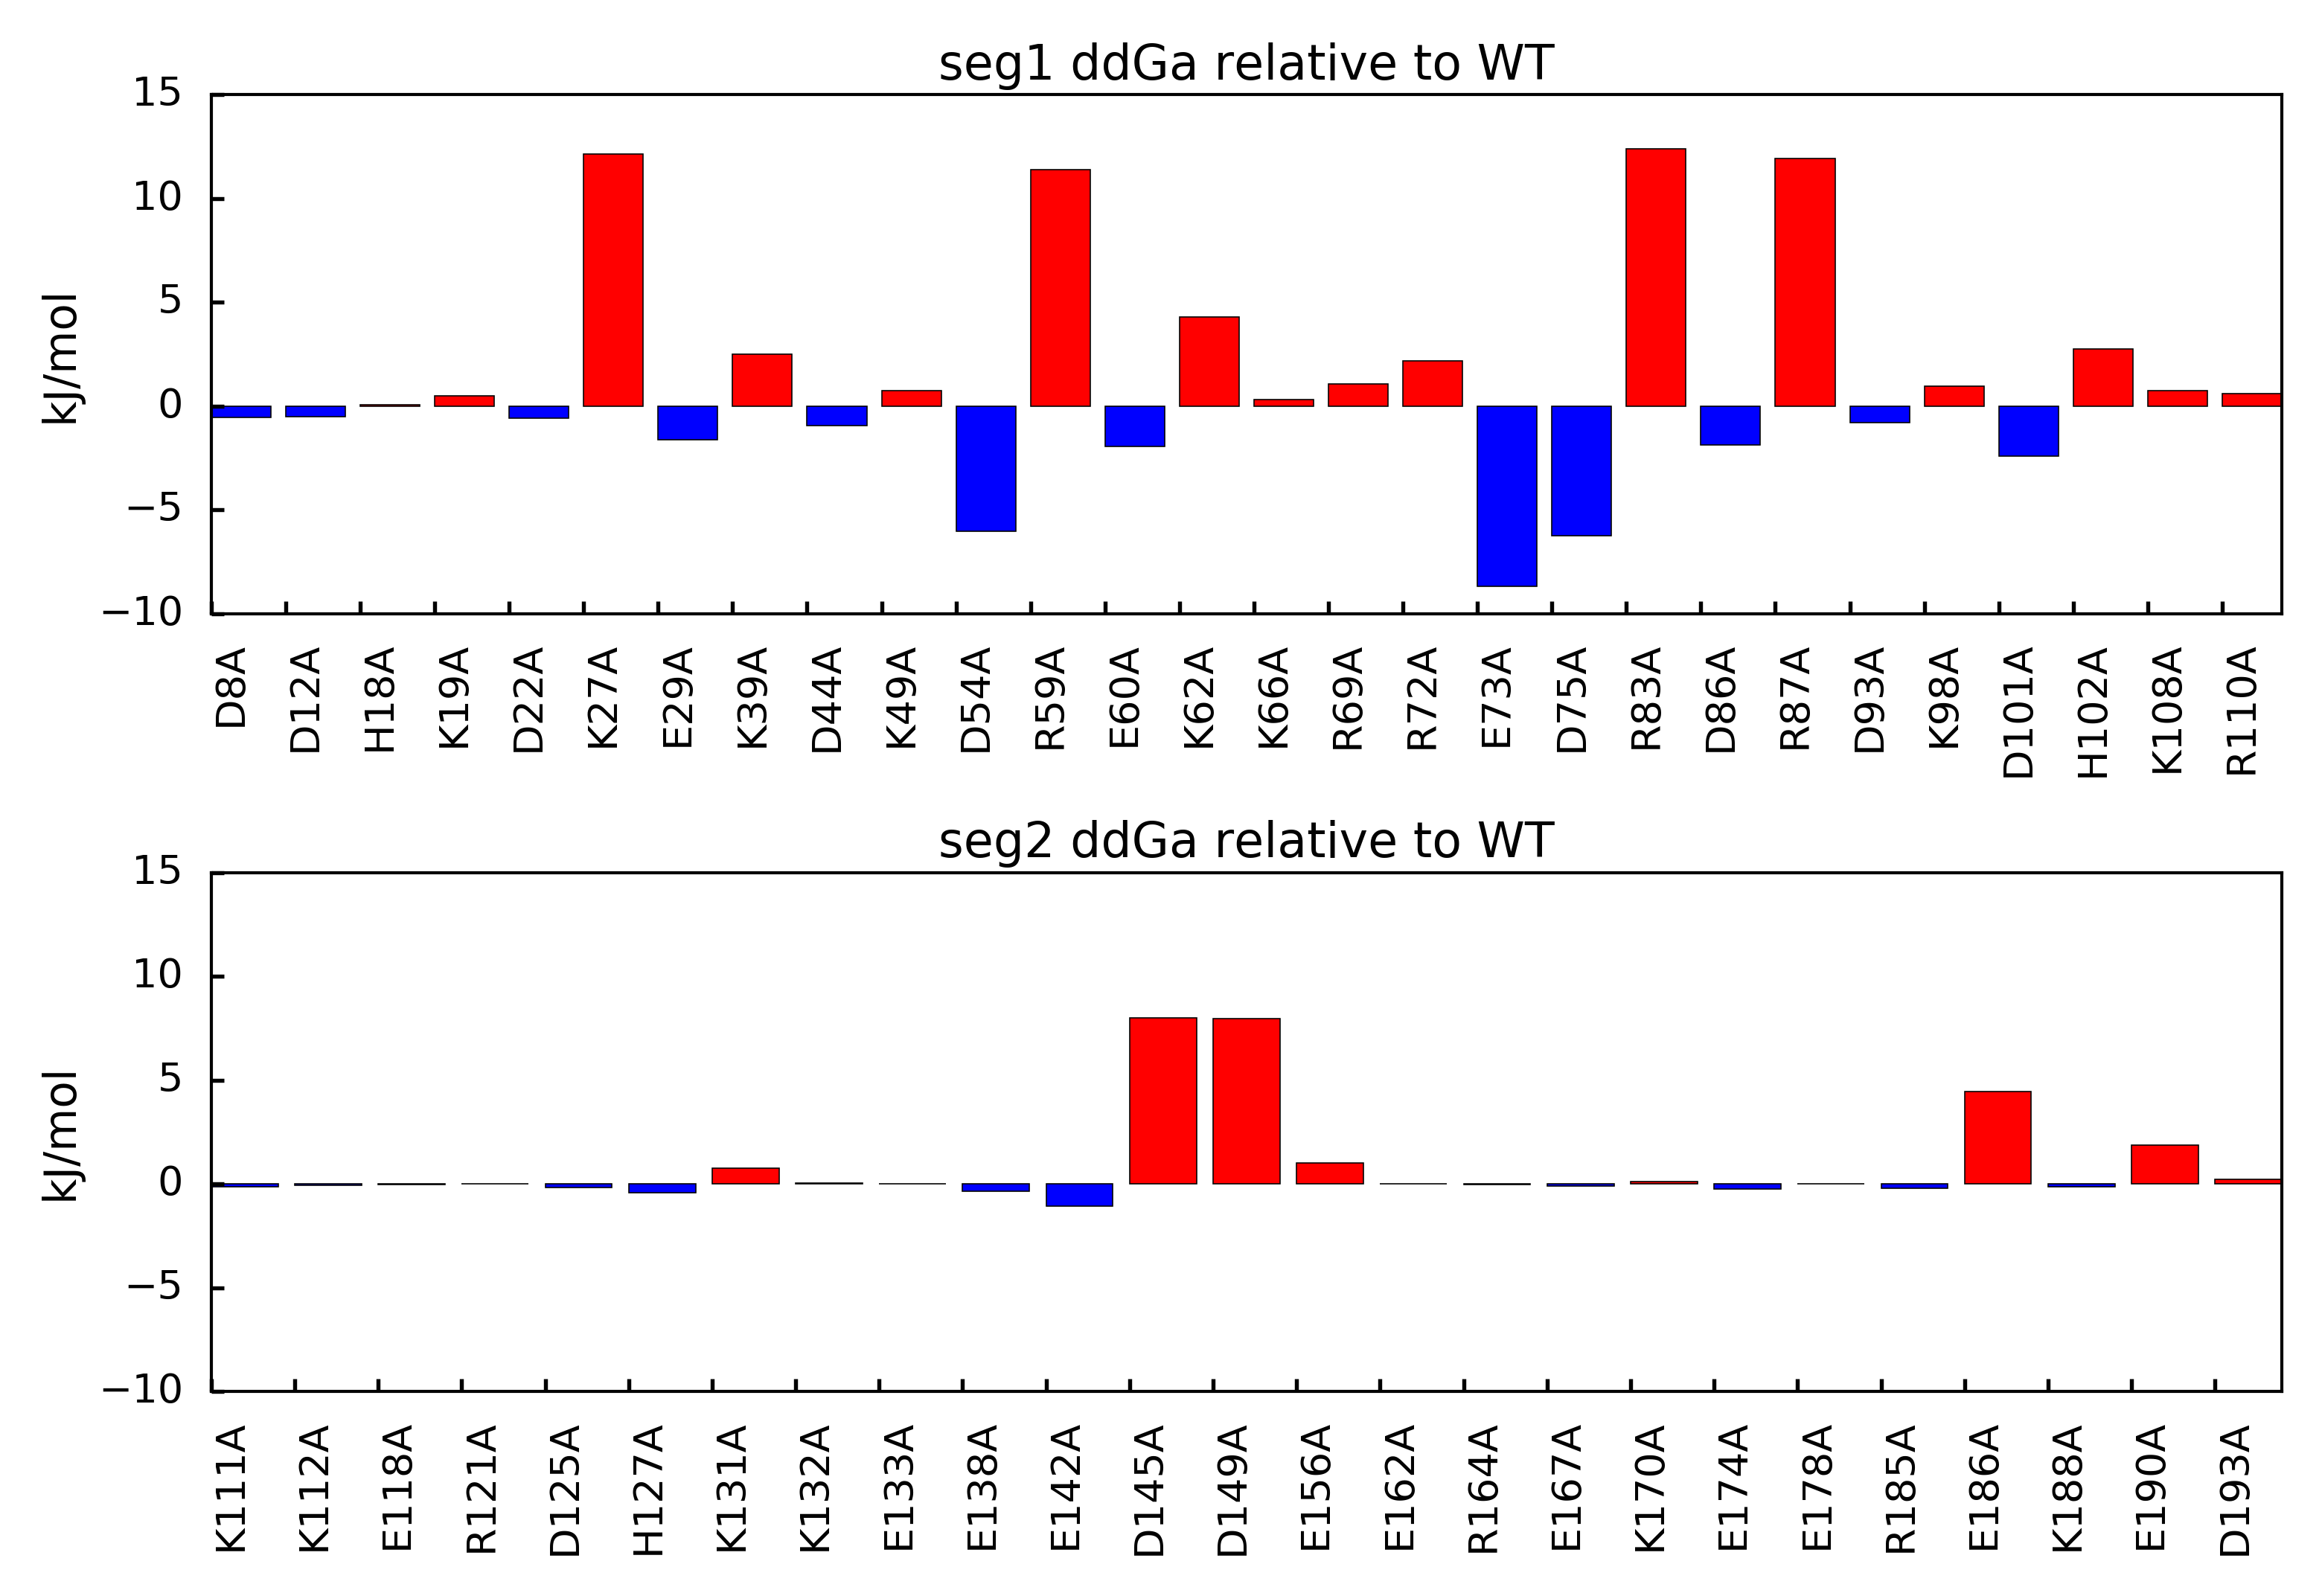
In this figure, mutations that result in positive ddGa values relative to the parent structure suggest loss of binding mutations. This outcome indicates the mutated amino acid was involved in an overall favorable network of electrostatic interactions in the parent structure. Mutations that result in negative ddGa values relative to the parent structure suggest gain of binding mutations. This outcome indicates the mutated amino acid was involved in an overall unfavorable network of electrostatic interactions in the parent structure.
Alternatively, you can view the results as a network if you have installed the NetworkX library:
try:
    plotNetwork(alascan, filename='network.png')
except:
    print 'Skipping plotNetwork example!'
You can ignore the try/except blocks with general use. These are here only for those users who do not wish to install Networkx. The network should look similar to the following with standard parameters:
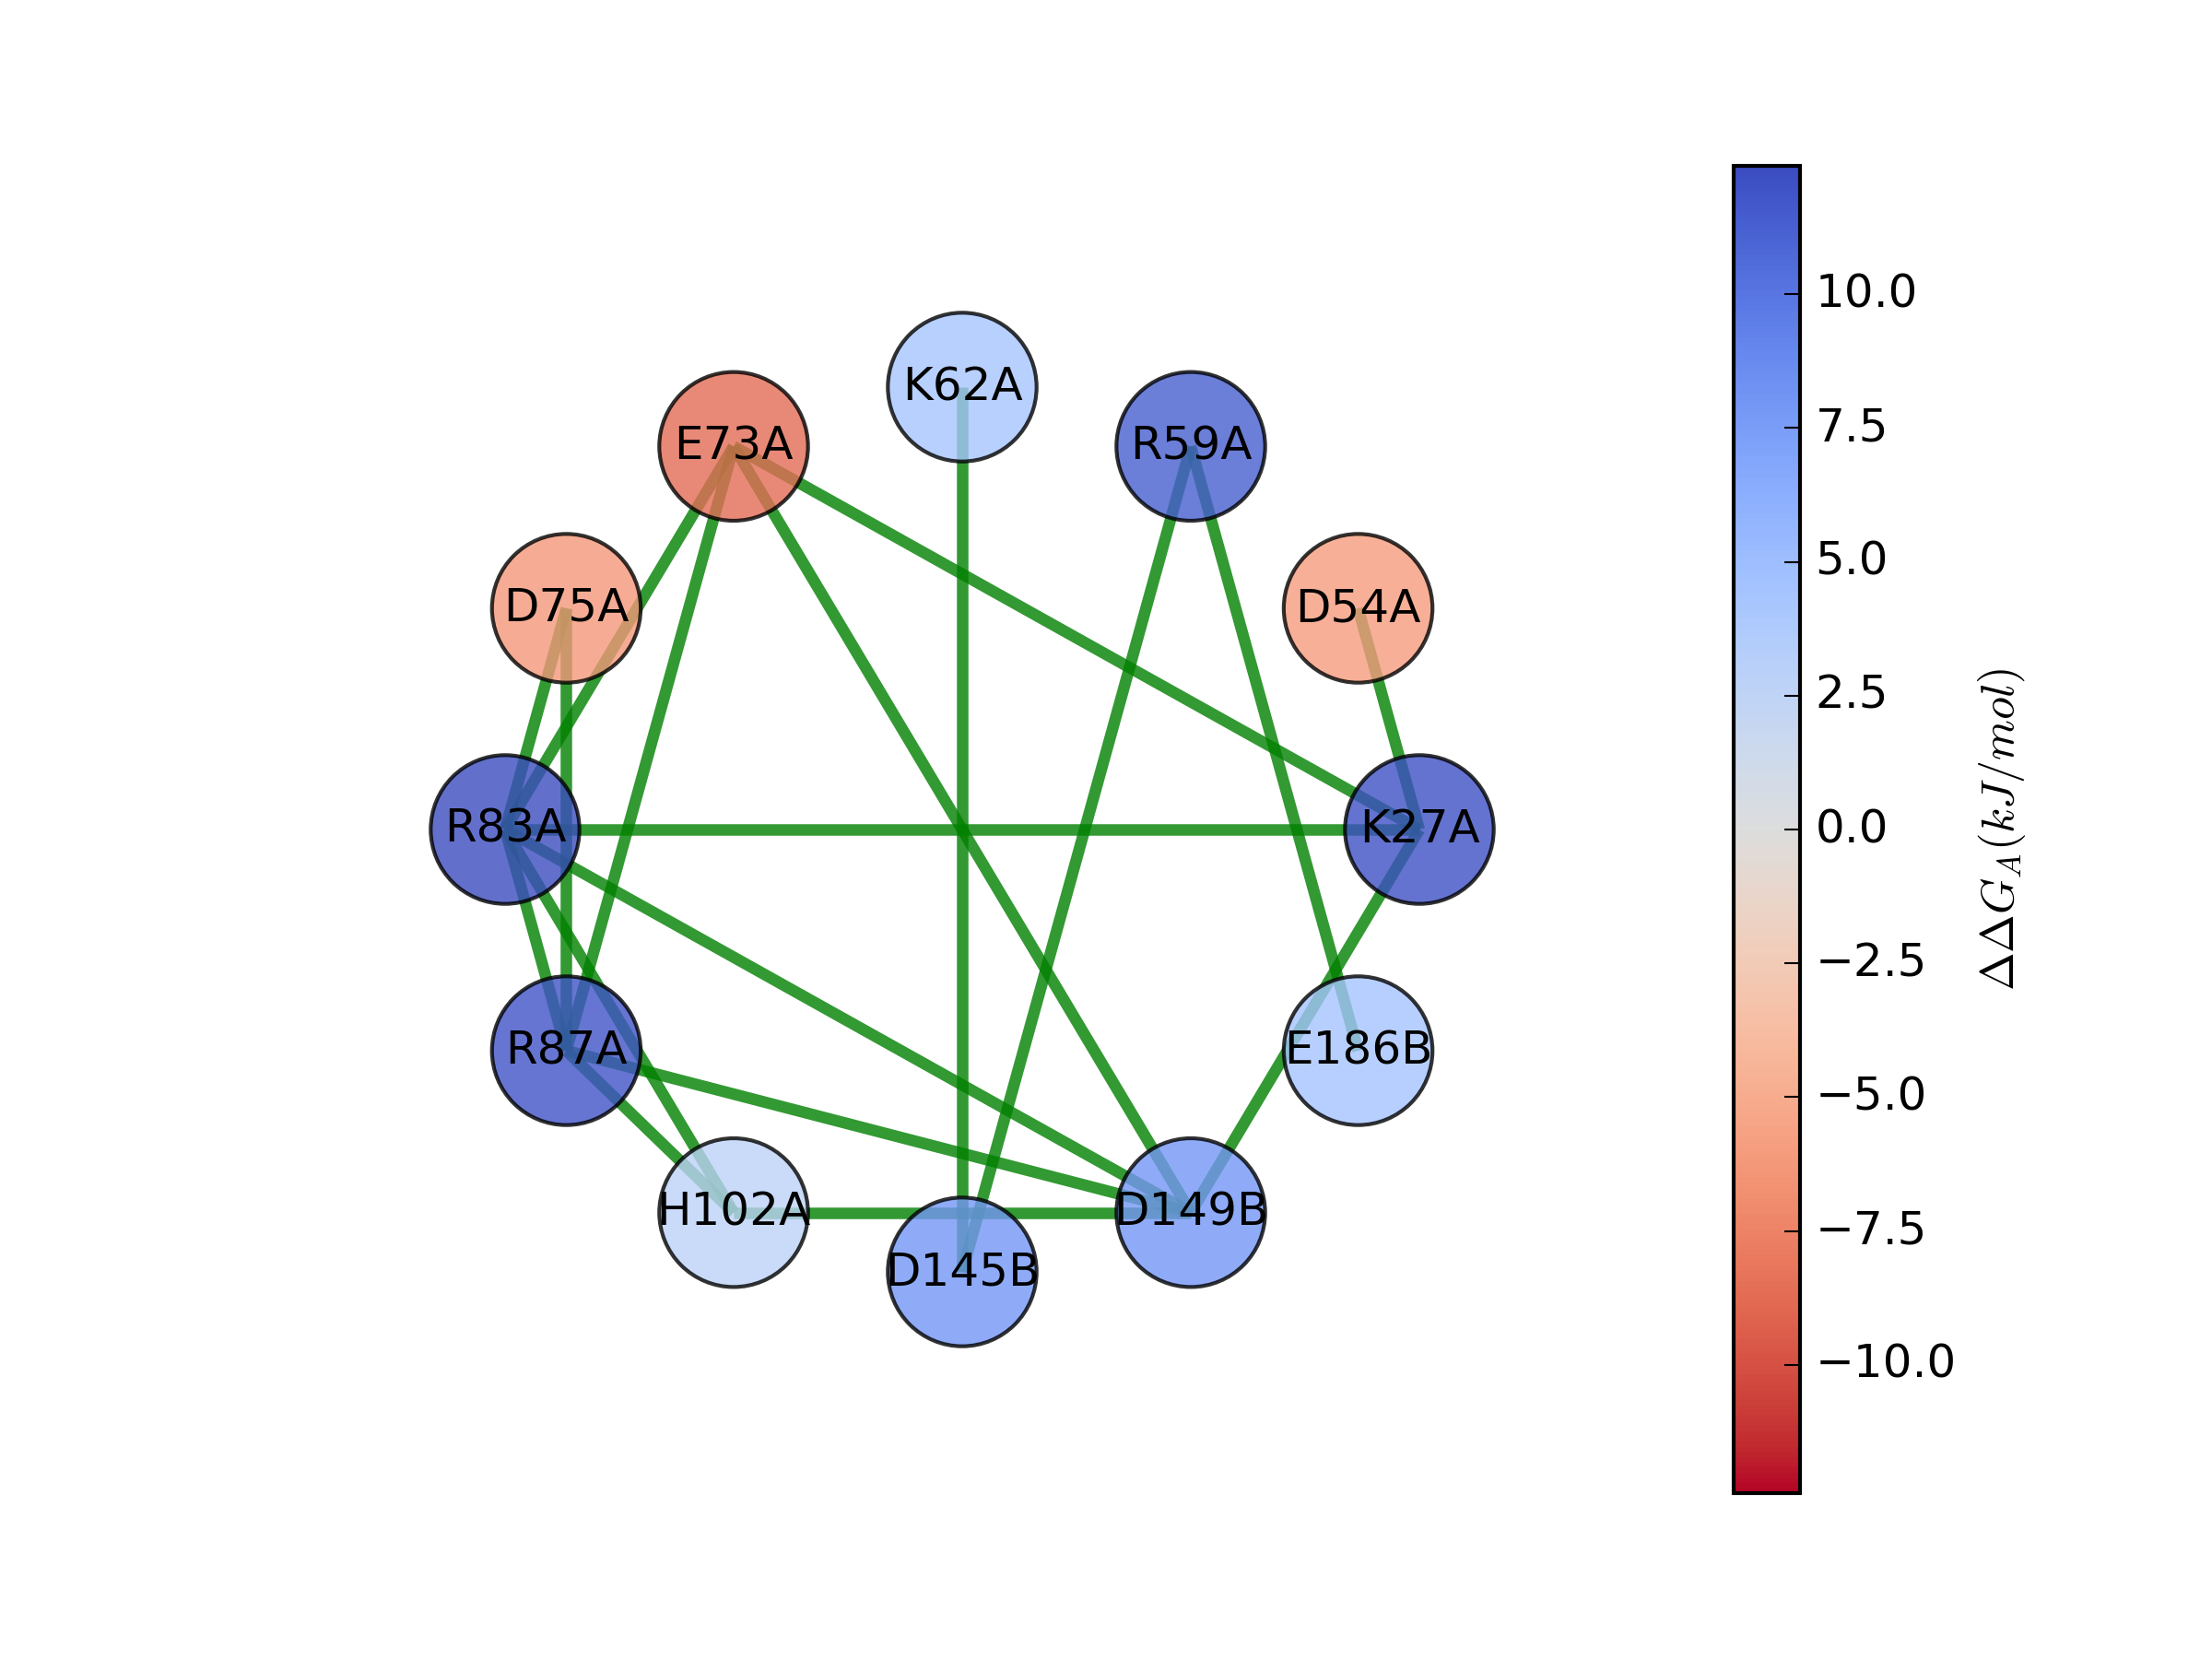
In this figure, nodes are amino acid with significant energy effects. That is, when the residue is mutated the change in free
energy of association relative to the parent structure is outside thermal effects (greater than 2.5 kJ/mol or less than -2.5
kJ/mol). Colors of each node are scaled according to the value of this energy, and edges are drawn between Coulombic interactions
that occur within some distance cutoff (5 angstroms by default). Node labels consist of the one-letter amino acid code, the
residue number, and the chain where the residue is located, in that order. For instance, R83A is arginine 83 on chain A.
If you would like to utilize the interactive plotting functions plotScan_interactive and plotNetwork_interactive, refer
to this notebook demonstration.
You may also extract the free energies of association and the associated mutation ids:
mut_ids  = alascan.getMutids()
energies = alascan.ddGa_rel()
If you wish, you can use build in function to summarize results. If the file name is not specified for the summary, then the summary is simply printed to STDOUT:
alascan.summary(filename='alascan_summary.txt')
Finally, you may export a PDB file with ddGa values for each residue in the beta-factor column as follows:
writePDB(alascan, filename='alascan.ddGa.pdb')